微信聊天记录可视化
谨慎食用
数据获取
电脑端迁移聊天记录
- 迁移手机和接收电脑设置在同一局域网内【手机电脑连同一WiFi】
- 微信-通用-聊天记录-聊天记录迁移与备份-迁移-迁移到电脑【可选迁移全部聊天记录】或【迁移指定聊天记录】
- 确认电脑端聊天记录是否成功,若成功,手机退出微信运行,重启打开。
下载留痕软件 获取电脑端微信聊天记录
- 开源软件留痕下载地址,选择对应下载版本。【好像只支持Windows版本,mac系统的姐妹收手吧】
- 运行文件中的MemoTrace.exe-获取信息-点击解析 等待数据解析完成即可。
- 点击好友-再点击好友对象,即可获取与好友的聊天信息分析。
PS:如果发现信息解析不完全,但确认聊天记录已在电脑端,退出电脑微信重新登录且关闭MemoTrace.exe,重新开启解析即可。
导出数据
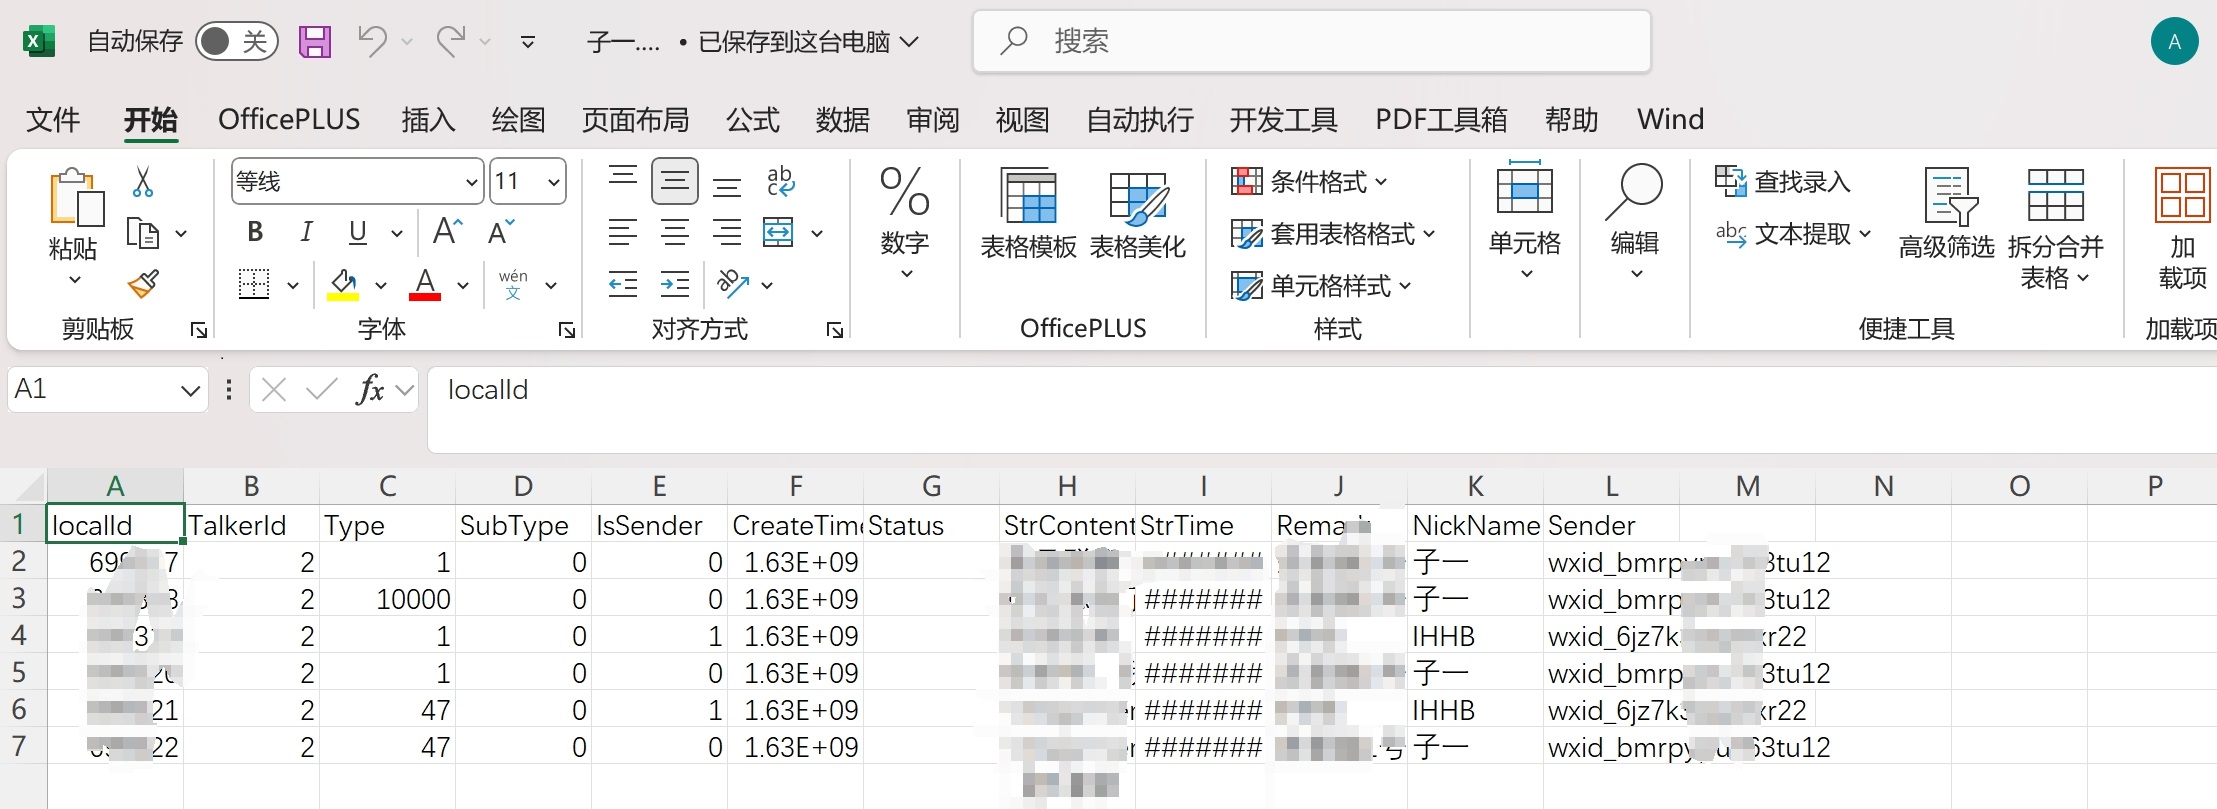
- 程序开源作者已经提供初步的分析,但如果想要更细致更个性化的分析,可导出数据自行分析。点击聊天记录导出-导出CSV,【但导出的csv数据只有聊天文字信息】
- 导出数据如下图所示:
数据分析
准备工作
导入第三方库
1 | import pandas as pd |
导入数据
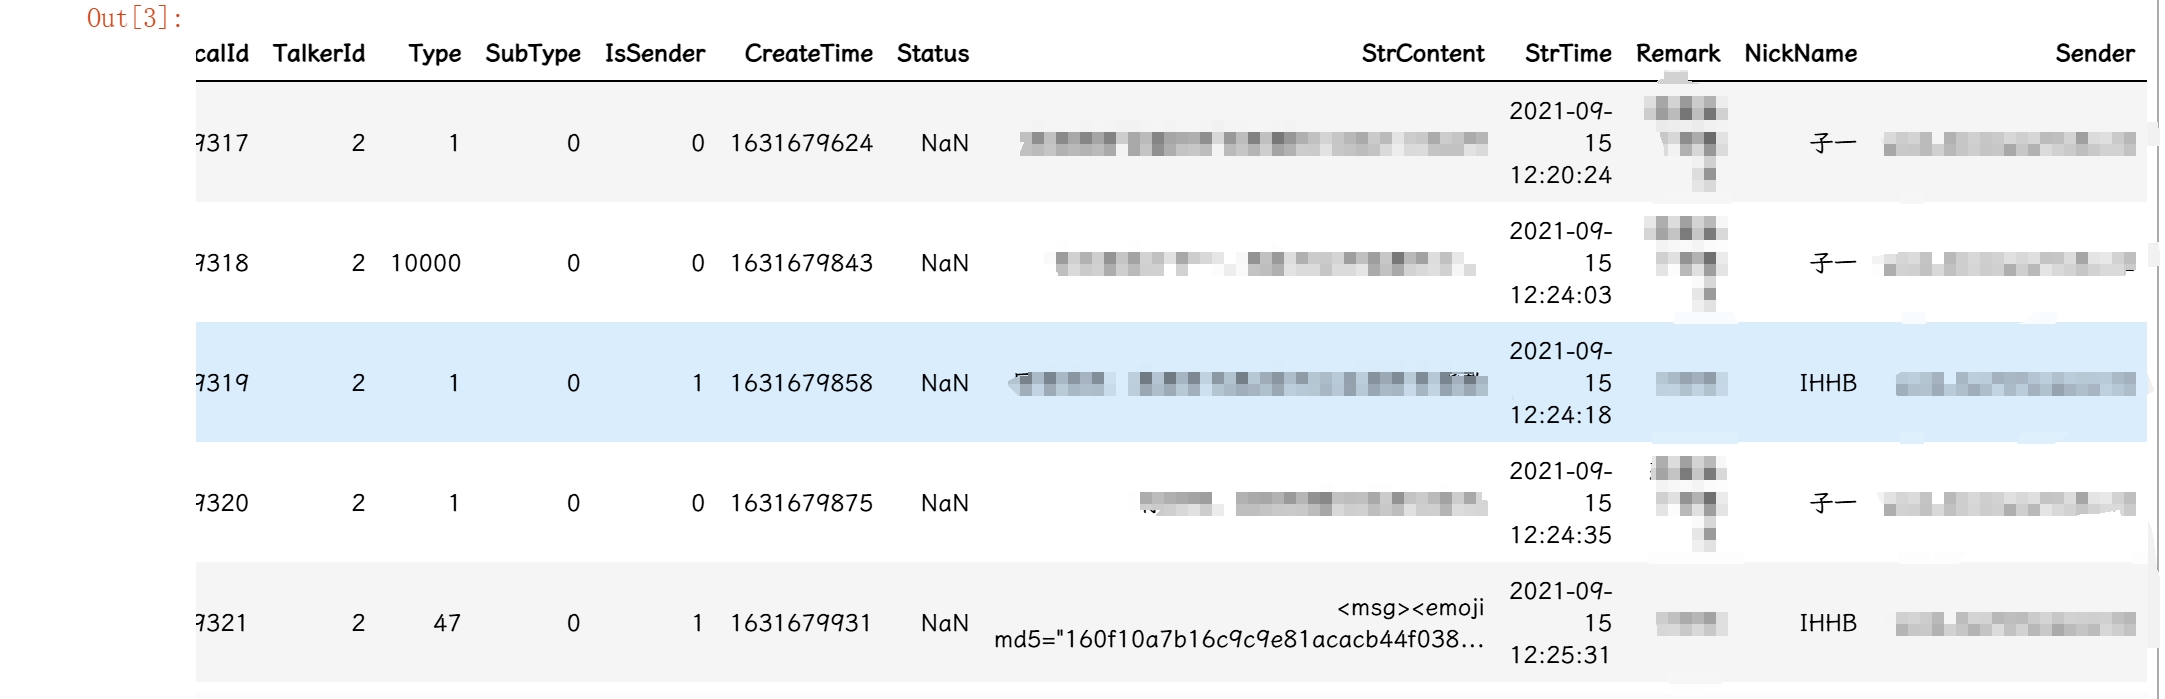
– 前6个字段数据类型为int64,后面字段数据类型为object。
– Type: 发送内容的类型
– IsSender: 是否是自己发出的消息,也就是标记消息展示在对话页左边还是右边,取值0或1。
– StrContent:信息内容
– StrTime: 信息发送时间
– Remark: 微信备注
– NickName: 微信昵称
1 | data = pd.read_csv('子一.csv') |
- 生成保存图片的文件夹
1
2
3
4
5# 检查文件夹是否存在,如果文件夹不存在,则创建
folder_path = '图片信息'
if not os.path.exists(folder_path):
os.makedirs(folder_path)
图像绘制函数
PS:因为下面分析会多次用到下面图像绘制函数,因此先定义图像函数,后面直接调用即可。
获取字典中值最大的数
1
2
3
4
5
6
7
8# 统计谁最多,res字典格式
def Get_most_Value(res):
res_key = max(res, key=res.get)
res_value = res[res_key]
return res_key,res_value获取词频前20个使用频率最高的词汇
1
2
3def Get_top20(res):
top_20 = dict(sorted(res.items(), key=lambda item: item[1], reverse=True)[:20])
return top_20绘制词云图函数
PS:停用词库需下载且放在与py文件同一路径下。若词云图显示字体报错,可查看系统是否安装simkai.ttf字体。1
2
3
4
5
6
7
8
9
10
11
12
13
14
15
16
17
18
19
20
21
22
23
24
25
26
27
28
29
30
31
32
33
34
35
36
37
38
39
40
41
42
43
44
45
46
47
48
49
50
51
52# 绘制词云图
def Draw_Yuntu(content,pic_path=None):
# 去掉字符串中的所有符号
text = re.sub(r'[^\w\s]', '', content.replace('\n','') )
# 使用jieba进行中文分词
words = jieba.cut(text, cut_all=False)
# 去掉停用词且去掉单字
## 读取停用词
with open('停用词库.txt', encoding='utf-8') as f: # 可根据需要打开停用词库,然后加上不想显示的词语
con = f.readlines()
stop_words = set() # 集合可以去重
for i in con:
i = i.replace("\n", " ") # 去掉读取每一行数据的\n
stop_words.add(i)
stop_words
# 去掉停用词和单字
words_res = []
for word in words:
if word not in stop_words and len(word) != 1:
words_res.append(word)
# 计算词频
word_list = Counter(words_res)
# 生成词云
wordcloud = WordCloud(
font_path='simkai.ttf', # 确保字体路径正确
width=800,
height=400,
background_color='white' # 图片背景颜色
).generate_from_frequencies(word_list)
# 显示词云图
plt.figure(figsize=(16, 8))
plt.imshow(wordcloud, interpolation='bilinear')
plt.axis('off') # 关闭坐标轴
# 如果有图片路径传入,则保存图片,反之不保存。
if pic_path:
plt.savefig(pic_path, bbox_inches='tight', pad_inches=0)
# 绘制图像
plt.show()
return word_list绘制平滑曲线函数
PS:注意pic_path参数,传入路径参数,则保存图片;反之,不保存。1
2
3
4
5
6
7
8
9
10
11
12
13
14
15
16
17
18
19
20
21
22
23
24
25
26
27
28
29
30
31
32
33
34
35
36
37# 绘制平滑曲线图
def Draw_Linegraph(top_20,title_res,pic_path=None):
x = list( top_20.keys())
y = list( top_20.values())
x_new = np.linspace(0, len(x) - 1, 300) # 300个点进行插值
spl = make_interp_spline(np.arange(len(x)), y, k=3) # 使用样条插值
y_new = spl(x_new)
# 创建折线图
plt.figure(figsize=(20,6)) # 调整图像大小
plt.plot(x_new, y_new, color='b', label='数据线', linewidth=2) # 更平滑的曲线
# 添加标题和标签
plt.title(title_res, fontsize=24)
plt.xlabel('')
plt.ylabel('')
# 设置横坐标刻度
plt.xticks(ticks=np.arange(len(x)), labels=x, rotation=45, fontsize=12)
# 设置X轴的范围,减少标签之间的空隙
plt.xlim(-0.5, len(x) - 0.5) # 调整X轴范围
# 隐藏所有网格线
plt.grid(False) # 关闭网格线
# 显示图形
plt.tight_layout() # 自动调整子图参数,使之填充整个图像区域
# 如果有图片路径传入,则保存图片,反之不保存。
if pic_path:
plt.savefig(pic_path)
plt.show()绘制热力图函数
PS:注意pic_path参数,传入路径参数,则保存图片;反之,不保存。1
2
3
4
5
6
7
8
9
10
11
12
13
14
15
16
17
18
19
20def Draw_Heatmap(pic_data,pic_path=None):
# 绘制热力图
plt.figure(figsize=(20,6)) # 将图像调整为更大的正方形尺寸
sns.heatmap(pic_data, annot=False, cmap='YlGnBu', cbar=True, square=True,
cbar_kws={'shrink': 0.5}) # 调整颜色条大小,shrink 控制缩小比例
# 设置图表标签
plt.title('热力图')
plt.xlabel('')
plt.ylabel('')
# 如果有图片路径传入,则保存图片,反之不保存。
if pic_path:
plt.savefig(pic_path)
# 显示图表
plt.show()
return None绘制饼图函数
PS:注意pic_path参数,传入路径参数,则保存图片;反之,不保存。1
2
3
4
5
6
7
8
9
10
11
12
13
14
15
16
17
18def Draw_Piechart(res,res_title,pic_path=None):
labels = res.keys()
counts = res.values()
# 随机颜色列表
colors = ["darkorange", "orange", "navajowhite", "bisque", "antiquewhite", "cornsilk", "lightyellow"]
random.shuffle(colors)
plt.title(res_title)
plt.pie(counts, labels=labels, colors=colors[:len(labels)], autopct='%1.1f%%', startangle=140)
plt.legend(labels, title="图例", loc='upper left', bbox_to_anchor=(1, 1))
# 如果有图片路径传入,则保存图片,反之不保存。
if pic_path:
plt.savefig(pic_path)
plt.show()分析文本情感倾向分析函数
– 调用百度云API免费接口进行文本情感分析
PS:百度云API需注册验证获取API密钥,可免费调用50万次。注册地址
调用返回文本判定信息三种:积极、消极、中性,准确率较高,但调用速度慢,1小时处理1500条左右。
安装百度云API接口包:pip install baidu-aip1
2
3
4
5
6
7
8
9
10
11
12
13
14
15
16
17
18def word_mean(text):
# 初始化AipNlp对象
APP_ID = '自己申请注册的APP_ID'
API_KEY = '自己申请注册的 API_KEY '
SECRET_KEY = '自己申请注册的SECRET_KEY'
client = AipNlp(APP_ID, API_KEY, SECRET_KEY)
""" 如果有可选参数 """
options = {}
options["scene"] = "talk"
""" 带参数调用对话情绪识别接口 """
res = client.emotion(text, options)
res = {item['label']: item['prob'] for item in res['items']}
return res
– 使用SnowNLP包
安装第三方库:pip install snownlp
完全免费且速度较快,但准确率不高,且只返回两种类型:积极和消极,可使用自定义词语进行模型训练,提高准确度。
感觉可先调用百度云API获取部分数据的结果并将其喂给SnowNLP,但因为懒没展开这部分 ,具体可参考CSDN文章。
1 | # 使用SnowNLP对中文文本进行情感分析 |
数据总计分析
加微信时间
1 | # strtime数据类型为对象,转换为时间格式 |
相识多少天
1 | # 2.距离今天是多少天 |
聊天数
1 | # 3.聊天天数:每天唯一值的计数 |
信息发送数
1 | # 发送总条数 |
每天聊天情况
1 | # 5.每天聊天信息 |
文本分析
- 文字总数
1
2
3
4
5
6# 6.所有文本信息字数
all_text = data[data['Type'] == 1]['StrContent'].dropna().astype(str).tolist()
content = ''.join(all_text)
total_str_count = len(content)
total_str_count - 绘制文本信息词云图
1
2
3
4
5
6# 绘制词云图
content_word_pic_path = os.path.join(folder_path,'全部聊天词云图.png')
content_word_list = Draw_Yuntu(content,content_word_pic_path)
max_content_word_list_key,max_content_word_list_value = Get_most_Value(content_word_list)
max_content_word_list_key,max_content_word_list_value
- 常用词频统计
1
2
3
4
5
6# 最常说的20个词
content_word_list_top_20 = Get_top20(content_word_list)
content_word_list_top_20
# 绘制图像
Draw_Linegraph(content_word_list_top_20,'前20个最常发的词')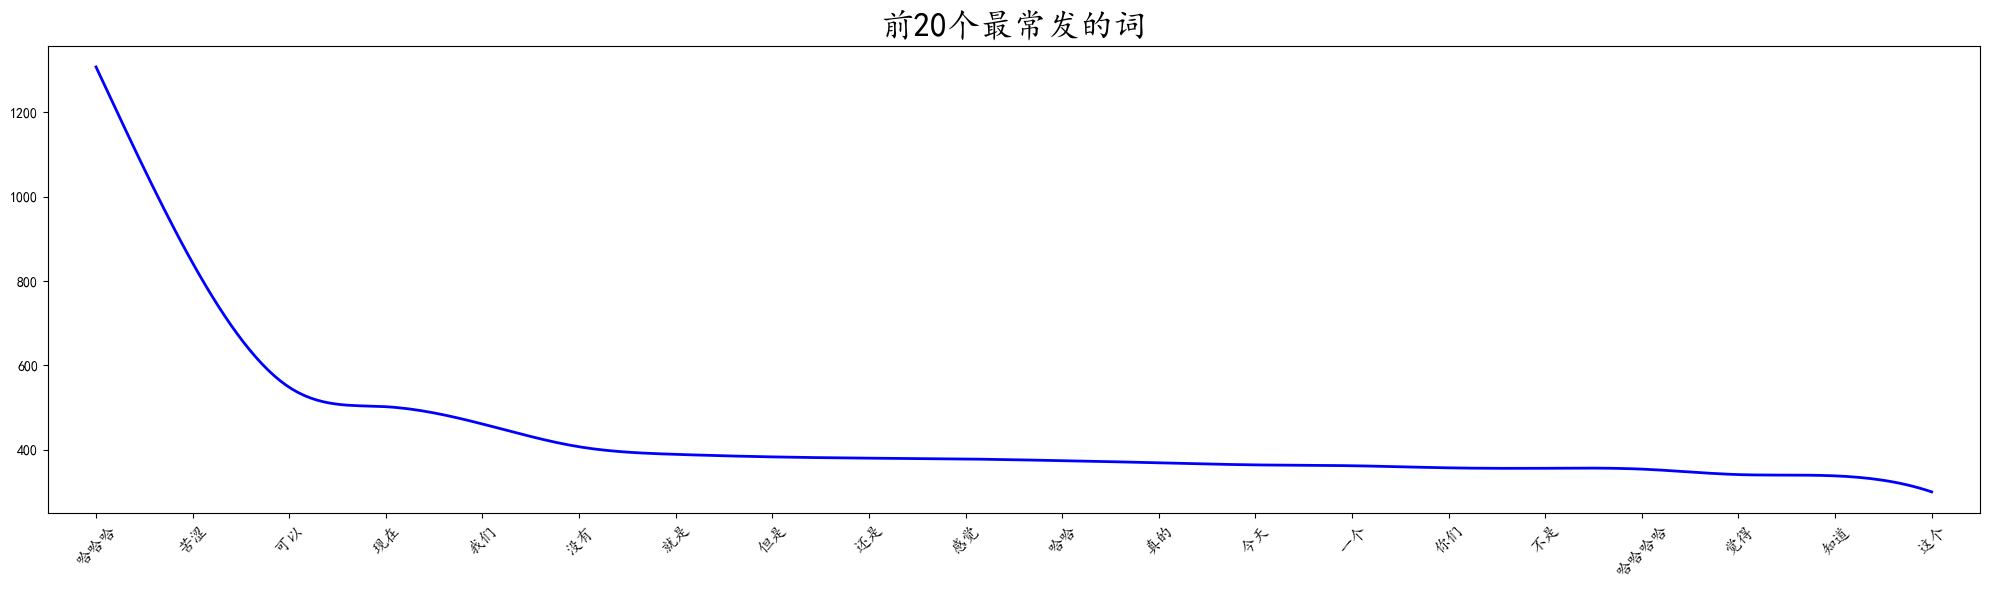
- 文本情感分析
1
2
3
4
5
6
7
8
9
10
11
12
13
14
15
16
17
18# 文本情感分析SnowNLP版本,返回一个数
res_final = []
for i in all_text:
try:
res_pro = sentiment_analysis(i)
if res_pro >= 0.5:
res_final.append('积极')
else:
res_final.append('消极')
except:
pass
sentiment_analysis_res = Counter(res_final)
sentiment_analysis_res
Draw_Piechart(sentiment_analysis_res,'文本情感倾向分析')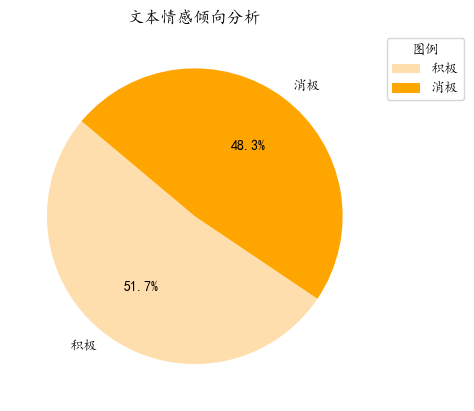
详细信息分析
聊天最多的一天
- 获取该天日期
1
2
3
4
5
6
7# 生成每天聊天信息记录
day_chat_counts = data.groupby([data['StrTime'].dt.date])['Sender'].count().to_dict()
# 1.聊天最多的一天及该天的信息数
max_day_chat_counts_key,max_day_chat_counts_value = Get_most_Value(day_chat_counts)
max_day_chat_counts_key,max_day_chat_counts_value
max_day_chat_day = max_day_chat_counts_key.strftime("%Y年%m月%d日") - 查看文本内容并绘制云图
1
2
3
4
5
6
7
8
9
10# 2.查看聊天最多一天的信息内容
# 获取聊天最多一天的数据
max_day_chat_df = data[data['StrTime'].dt.date == max_day_chat_counts_key]
# 获取文本信息作词频分析
max_day_chat_content = ''.join(max_day_chat_df[max_day_chat_df['Type'] == 1]['StrContent'].dropna().astype(str).tolist())
# 绘制词云图
max_day_chat_pic_path = os.path.join(folder_path,'最多聊天词云图.png')
max_day_chat_word_list = Draw_Yuntu(max_day_chat_content,max_day_chat_pic_path) - 词频统计并绘制平滑曲线图
1
2
3
4
5
6
7max_day_chat_word_list_key,max_day_chat_word_list_value = Get_most_Value(max_day_chat_word_list)
max_day_chat_word_list_key,max_day_chat_word_list_value
max_day_chat_word_list_top_20 = Get_top20(max_day_chat_word_list)
max_day_chat_word_list_top_20
Draw_Linegraph(max_day_chat_word_list_top_20,'前20个最常发的词')
各自发送的信息分析
- 自己发送的信息分析
1
2
3
4
5
6
7
8
9
10
11
12
13
14# 获取自己发送的数据
data_myself = data[data['IsSender'] == 1]
# 获取文本信息作词频分析
data_myself_chat_content = ''.join(data_myself[data_myself['Type'] == 1]['StrContent'].dropna().astype(str).tolist())
# 绘制词云图
data_myself_chat_word_list = Draw_Yuntu(data_myself_chat_content)
# 获取前20个最常说的词汇
data_myself_chat_word_list_top_20 = Get_top20(data_myself_chat_word_list)
data_myself_chat_word_list_top_20
Draw_Linegraph(data_myself_chat_word_list_top_20,'前20个最常发的词') - 对面发送的信息分析
1
2
3
4
5
6
7
8
9
10
11
12
13
14
15# 获取对面发送的数据
data_other = data[data['IsSender'] == 0]
# 获取文本信息作词频分析
data_other_chat_content = ''.join(data_other[data_other['Type'] == 1]['StrContent'].dropna().astype(str).tolist())
# 绘制词云图
data_other_chat_word_list = Draw_Yuntu(data_other_chat_content)
# 获取前20个最常说的词汇
data_other_chat_word_list_top_20 = Get_top20(data_other_chat_word_list)
data_other_chat_word_list_top_20
Draw_Linegraph(data_other_chat_word_list_top_20,'前20个最常发的词')
最常聊天时段
1 | # 聊天时段划分 |
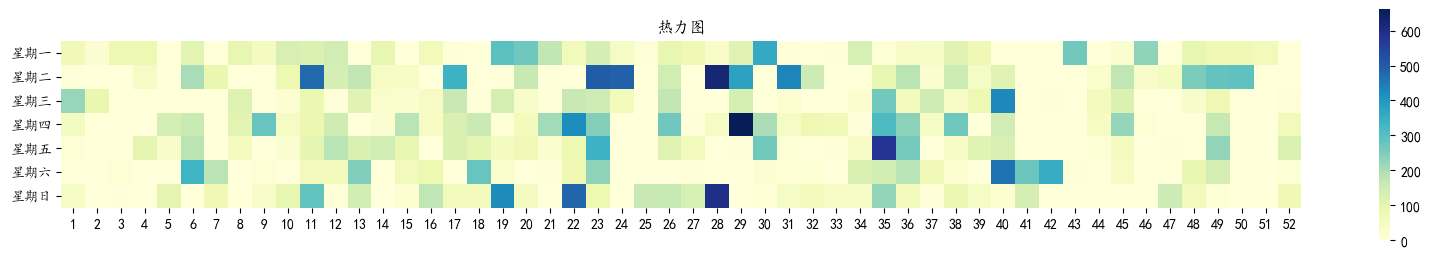
每周聊天情况分析
1 | # 统计每周聊天情况 |
自动生成PPT&PDF报告
可以直接利用数据生成HTML文档,但是因为不太会HTML,遂弃。原本还想着用Python连接H5,自动化生成H5,发现也不太可行。最后选择制作一份相对固定的PPT模板,利用Python对PPT内容进行修改,最后生成PDF文档。
自动化生成PPT报告
- 准备一个可视化PPT模板,对需要更新文字图片的对象类型重新命名,方便后续Python一对一输入修改。【形状格式-选择窗口-修改对应的对象】
- 因为菜,所以暂时无法解决微信头像自动下载的问题,需要提前将俩人的微信头像放入“图片信息”文件夹【若不需要微信头像,replace_pic直接删除前2个元素】
- 用spire.presentation这个库转换PDF,图片清晰度会损失;但是用Win32一直报错,暂时解决不了。
1
2
3
4
5
6
7
8
9
10
11
12
13
14
15
16
17
18
19
20
21
22
23
24
25# 键是文本框名字,值是该文本框输入内容
replace_content = {
'自己微信昵称': NickName_myself,
'对面微信昵称': NickName_other,
'第一次见面时间': the_first_time.date(),
'相识天数': days_difference,
'地球圈数': round(days_difference * 5 * 24 / 40076, 1),
'发送信息数': data_num,
'文本总数': total_str_count,
'最常发送词': max_content_word_list_key,
'词频数': max_content_word_list_value,
'聊天最多一天': max_day_chat_day,
'聊天最多一天信息数': max_day_chat_counts_value,
'活跃时间段': most_common_time[0],
'最多星期': top_strtime[0],
'次多星期': top_strtime[1]
}
# 需要更新图片的位置
replace_pic = ['自己头像', '他人头像', '全部聊天词云图', '最多聊天词云图', '活跃时间图', '聊天星期图']
pptfile_name = '微信聊天可视化模板.pptx'
pdffile_name = '微信聊天可视化.pdf'
PPT文档转PDF文档
- 若PPT文档中存在特殊字体,PPT文档需将文字嵌入文档,否则转换成PDF文字格式会出错。
1
2
3
4
5
6
7
8
9
10
11
12
13
14
15
16
17
18
19
20
21
22
23
24
25
26
27
28
29
30
31
32
33
34
35
36
37
38
39
40
41
42
43
44
45
46
47
48
49
50
def Get_pdf(replace_content, replace_pic, pptfile_name, pdffile_name, folder_path):

    # 打开现有的 PPT 文件
    ppt = pptx.Presentation(pptfile_name)

    # 遍历所有幻灯片
    for slide in ppt.slides:

        # 记录头像的形状信息
        avatar_shapes = []

        for shape in slide.shapes:
            # 检查形状是否有文本框
            if hasattr(shape, "text_frame") and shape.name in replace_content :
                new_value = str(replace_content[shape.name])
                for paragraph in shape.text_frame.paragraphs:
                    for run in paragraph.runs:
                        run.text = new_value
                        new_value = ""  # 避免多次重复替换

            elif shape.shape_type == 13 and any(pic in shape.name for pic in replace_pic):
                pic_name = next(pic for pic in replace_pic if pic in shape.name)

                if pic_name in ['自己头像', '他人头像']:
                    avatar_shapes.append((shape.left, shape.top, shape.width, shape.height, pic_name))
                    slide.shapes._spTree.remove(shape._element)
                else:
                    new_image_path = os.path.join(folder_path, pic_name + '.png')
                    slide.shapes.add_picture(new_image_path, shape.left, shape.top, width=shape.width, height=shape.height)

        # 重新插入头像图片并下移一层【为了微信头像是圆形!】
        for left, top, width, height, pic_name in avatar_shapes:
            new_image_path = os.path.join(folder_path, pic_name + '.png')
            new_shape = slide.shapes.add_picture(new_image_path, left, top, width=width, height=height)
            slide.shapes._spTree.remove(new_shape._element)
            slide.shapes._spTree.insert(0, new_shape._element)

    new_ppt_name = os.path.abspath(f'{pptfile_name.split(".")[0]}生成结果.pptx')   # 生成PPT内容
    ppt.save(new_ppt_name)

    # PDF 转换
    presentation = Presentation()
    presentation.LoadFromFile(new_ppt_name)
    presentation.SaveToFile(pdffile_name, FileFormat.PDF)
    presentation.Dispose()

# 调用
Get_pdf(replace_content, replace_pic, pptfile_name, pdffile_name, folder_path)
 wechat
 alipay